 East Baton Rouge Homes Sales and Prices Improve Dramatically In September 2012
Wow! What a difference a year make in Baton Rouge
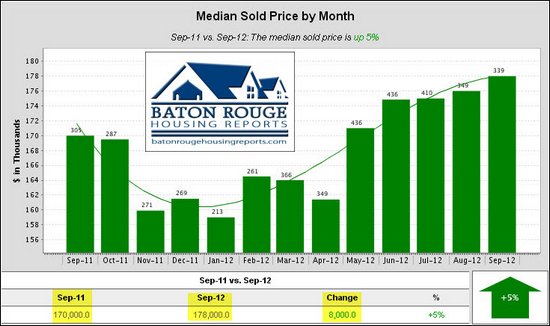
Real Estate! When comparing ALL East Baton Rouge home sales, except mobile or
manufactured housing, from September 2011 versus September 2012, the median sold
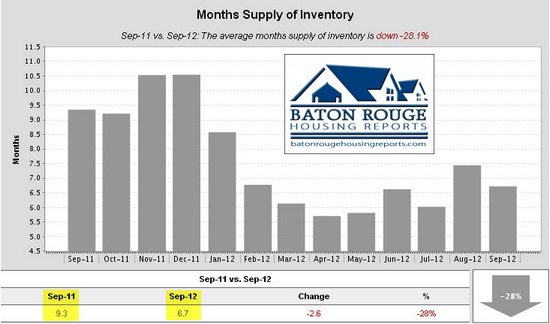
price is up 5% from $170,000 to $178,000. The months supply of inventory
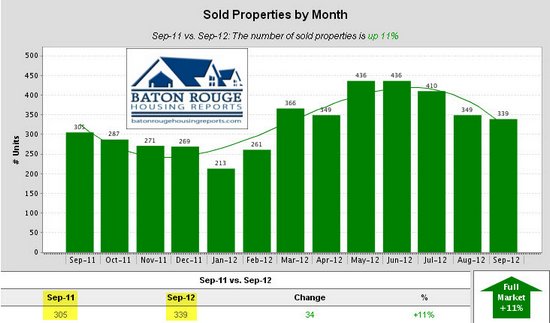
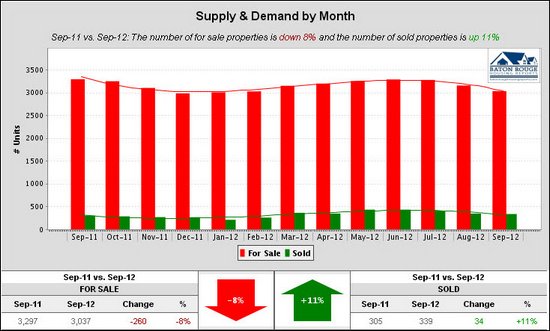
is down 28% from 9.3 to just 6.7 months of inventory. Number of sold properties
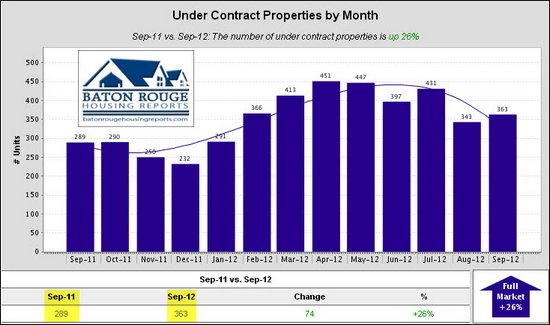
is up 11% from 305 to 339 units. Number of homes under contract increased 26%
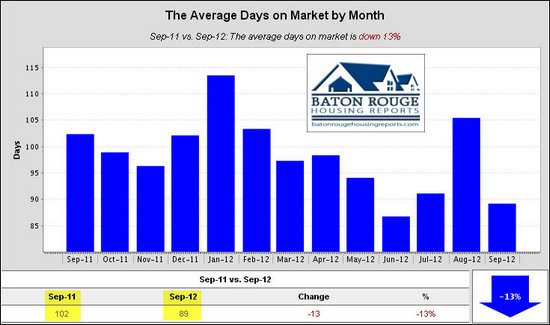
from 289 to 363 units. And, the average days on the market declined 13%
from 102 to 89 days. Charts below are Courtesy of Baton Rouge’s Home Appraiser Bill Cobb Appraiser and Baton Rouge Housing Reports
Median Sold Price by Month
Sep-11 vs. Sep-12: The median sold price is up 5%
Months Supply of Inventory
Sep-11 vs. Sep-12: The average months supply of inventory is down -28.1%
Sold Properties by Month
Sep-11 vs. Sep-12: The number of sold properties is up 11%
Under Contract Properties by Month
Sep-11 vs. Sep-12: The number of under contract properties is up 26%
Average Days on Market by Month
Sep-11 vs. Sep-12: The average days on market is down 13%
Supply & Demand by Month
Sep-11 vs. Sep-12: The number of for sale properties is down 8% and the number of sold properties is up 11%
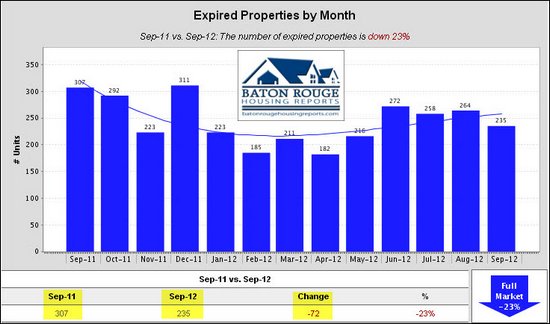
Expired Properties by Month
Sep-11 vs. Sep-12: The number of expired properties is down 23%
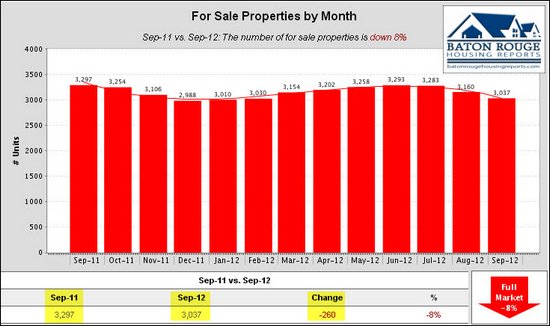
For Sale Properties by Month
Sep-11 vs. Sep-12: The number of for sale properties is down 8%
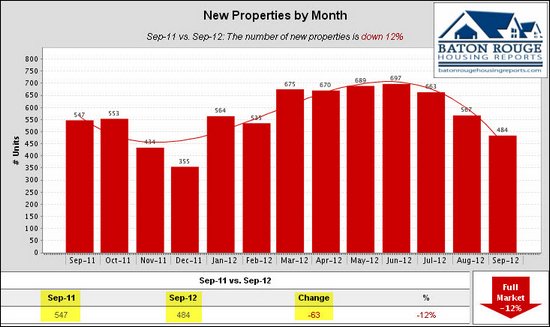
New Properties by Month
Sep-11 vs. Sep-12: The number of new properties is down 12%
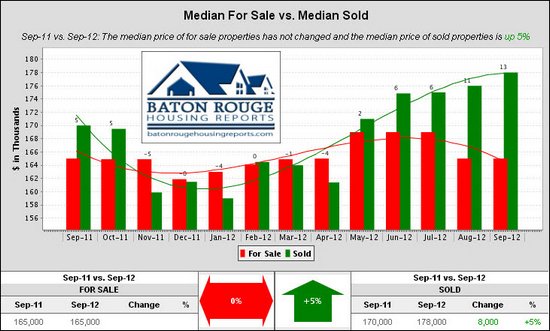
Median For Sale vs. Median Sold
Sep-11 vs. Sep-12: The median price of for sale properties has not changed and the median price of sold properties is up 5%
East Baton Rouge Real Estate Housing Market Comparison 09 2011 vs 09 2012
East Baton Rouge Real Estate Housing Market Comparison 09 2011 vs 09 2012
GBRAR MLS NOTE: Based on info from the Greater Baton Rouge Association of REALTORS®\MLS for the period of 09/16/2011 to 09/16/2012. This information was extracted on 09/17/2012. Includes ALL housing types except mobile and manufactured housing.
Baton Rouge Pre-Listing Appraisals